Land· CityMETER · Suan Phlu, Bangkok
How much city fits inside Suan Phlu?
Buildings: Footprints, Height & Estimated Floor AreaThe Suan Phlu view contains 2,417 buildings, with an estimated 3.89 million square metres of floor area. Counting rooftops tells one story. Adding the floors above them reveals another: how much city is stacked inside a neighbourhood.
A view inside CityMETER
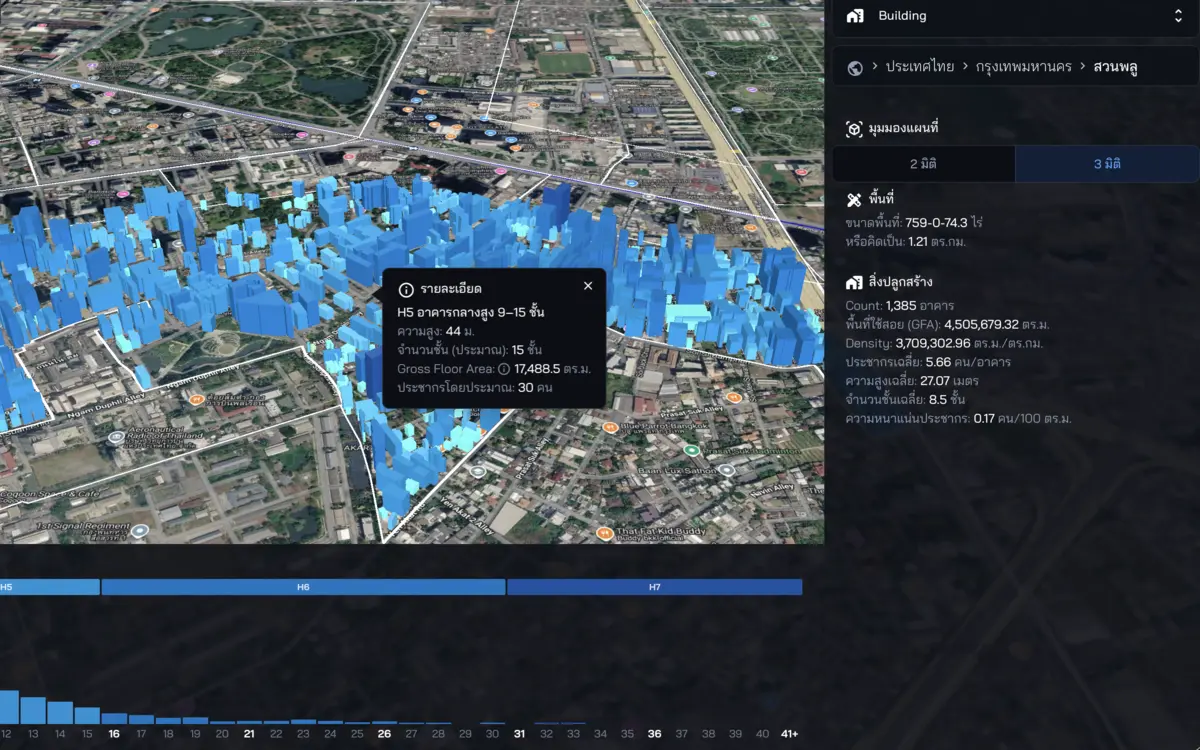
Suan Phlu view inspected on 10 October 2026 · V4, December 2024 · estimated floor area: 3,887,290.69 m².
- Data period
- V3 May 2023 · V4 Dec 2024
- Coverage
- Areas covered by each version
- Level of detail
- Buildings · estimated height and floor area
- Publisher
- V4: 3D-GloBFP / OSM · V3: Google Research
Beyond the roofline
Two buildings can occupy similar patches of ground while containing very different amounts of space. Height and floors change what a footprint means. That is why the Suan Phlu example is useful to anyone planning a neighbourhood visit: it separates the spread of buildings across the ground from the volume of accommodation above it. The map gives a spatial question a concrete starting point. Where are buildings concentrated? Which clusters account for substantial estimated floor area? Which locations deserve a closer look at entrances, activity and the way buildings connect to the street?
What the pattern lets people ask
For a team preparing local services, a building pattern can organise the first field visit. A cluster with substantial estimated floor area is a reason to look closely at entrances, pedestrian routes and connections to surrounding streets. The team can agree on places to investigate before leaving the office, then bring specific observations back. This is a practical relationship between a map and a person’s day: a mapped building becomes a question about reaching a door, finding an entrance or understanding how a street serves the buildings beside it. Each question can be checked on site.
From neighbourhood to a building
Move between two scales. At neighbourhood scale, look for the overall distribution of built form. Closer in, examine the geometry of the buildings that make a cluster interesting. Keep the selected data version consistent when comparing places, and read modelled height, floors and floor area together. This makes a comparison reproducible: another person can open the same version and see why a particular cluster was chosen. It also gives a field team a useful division of work—some observations concern a single building, while others concern the relationship between buildings and the surrounding streets.
Bring the map back to the street
The next useful product is a short observation list, not a verdict on the neighbourhood. Choose a few places from the map and record what a visit actually establishes: a working entrance, ground-floor use or the condition of a walking route. Keep these observations distinct from the model’s estimates. Together, they make a discussion more specific and easier to revisit. Suan Phlu’s 2,417 mapped buildings offer an entry point into that process. The estimated floor area reveals the scale of the built environment; the visit explains how a particular part of it is used.
Explore your own place
Open Suan Phlu in V4, choose a building cluster and identify three places where an entrance or actual use should be checked.
Sources and reading notesPublisher, period, coverage and references
Specialist source
- Data publisher
- 3D-GloBFP / OpenStreetMap for V4; Google Research for V3
- Source
- V4 uses 3D-GloBFP by Che et al. and OpenStreetMap; V3 uses Open Buildings. Read attribution with the selected version.
- Data period
- Available version labels: V3 May 2023 and V4 December 2024; these are not survey dates for every building.
- Coverage
- Explore building data within each version’s coverage; this example starts in Suan Phlu, Bangkok.
- Level of detail
- Building footprints and 3D geometry with area summaries; height, floors and floor area include estimates
Further notes for comparison or citation
Heights, storeys and floor areas include estimates. Check building records or survey the site before a building-specific decision.
Building coverage and derived values may be incomplete or inaccurate. Use them to study development patterns, then check records or field evidence for an individual building.