Land· CityMETER · Mueang Chiang Mai
More than a kilometre of relief between two Chiang Mai points
Terrain & ElevationOne point in Chiang Mai’s urban area reads 312.66 metres in FABDEM; a western hillside point reads 1,351.63 metres. The roughly 1,039-metre difference makes the vertical dimension tangible. Understanding this area begins with both its position on the map and the shape of the ground model.
This finding is based on
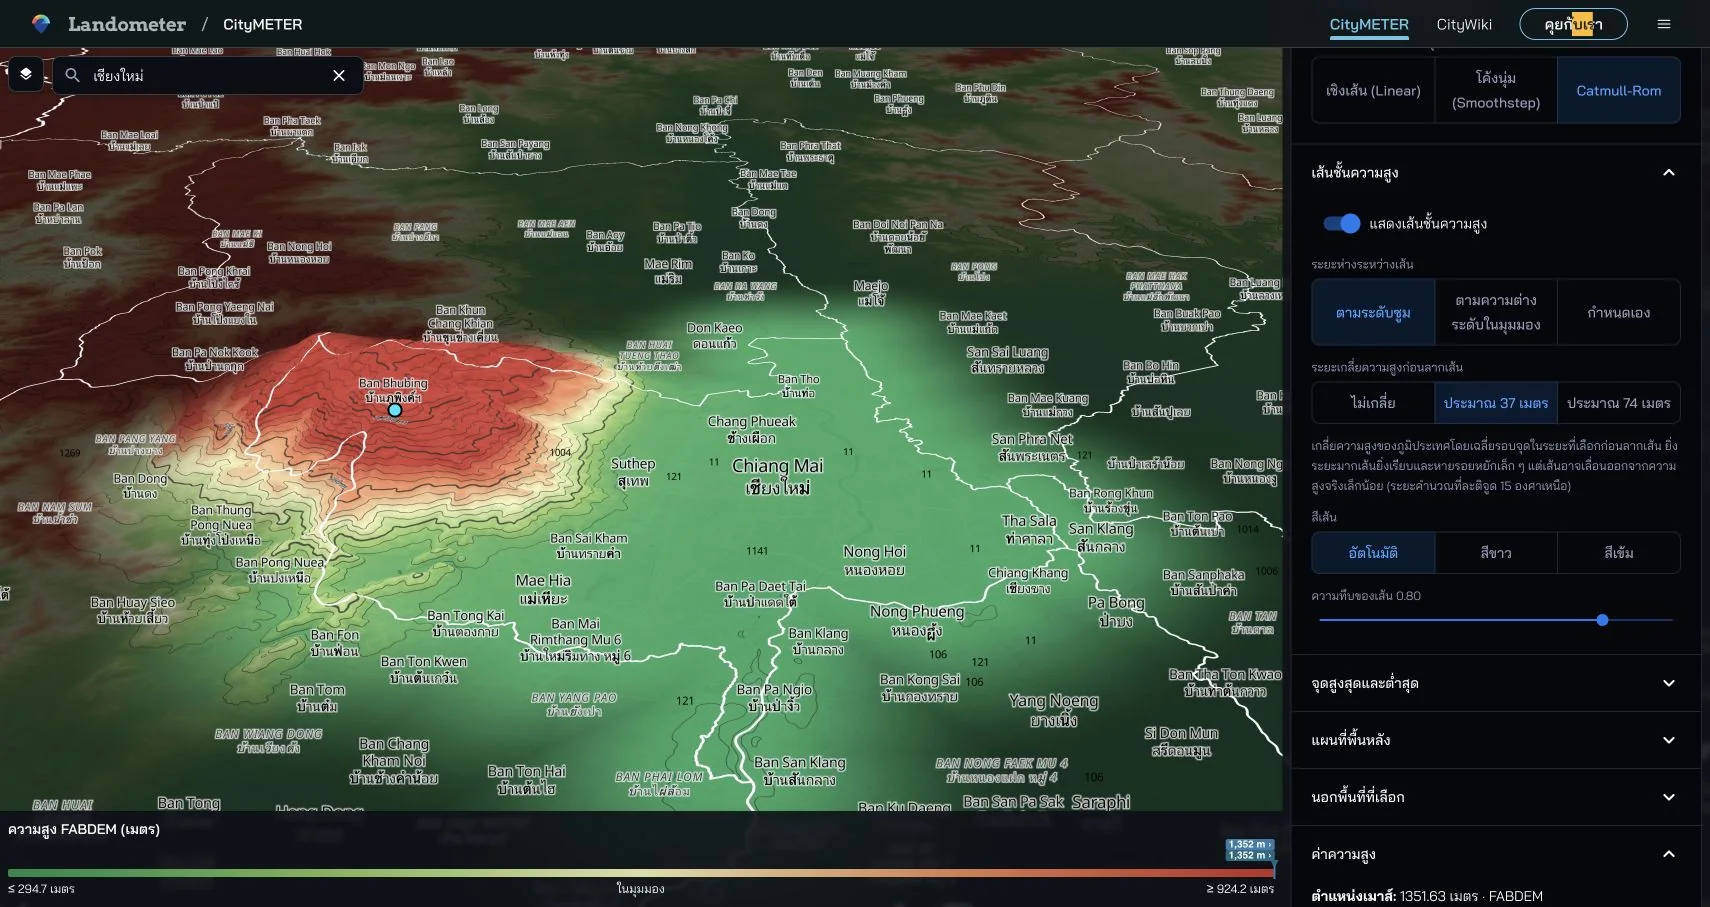
Mueang Chiang Mai · FABDEM V1-2 · inspected on 10 October 2026 · points 18.79236, 98.98480 and 18.80308, 98.89727 · difference between model readings: 1,038.97 m.
- Data period
- By elevation-model version
- Coverage
- Coverage of each elevation model
- Level of detail
- Modelled elevations · GLO-30 minus FABDEM
- Publisher
- FABDEM / Bristol · Copernicus · Mapzen Terrain Tiles
The vertical dimension changes what to look at
A flat map shows how positions relate to one another. Terrain adds another set of questions about level and landform. The Chiang Mai example makes that dimension visible through two identified coordinates. Someone preparing a visit can examine the relationship between the urban area and the western slopes, then note which places need closer attention on the ground. Numeric readings give the discussion a reference alongside the 3D view. The team can return to the same points and see why their difference became part of the enquiry.
Read the values beside the visual settings
The captured view uses 1.5× vertical exaggeration for display, while the point values are model readings in metres. Retaining the model name and visual settings lets another person understand the same example. Contours and the 3D view can help select areas for closer study; point readings provide references for the selected locations. When comparing several points, keep the model consistent and retain coordinates. The view then becomes a reproducible starting point for discussion rather than an attractive angle that is difficult for someone else to reconstruct.
Turn relief into a field agenda
For a site study, relief helps organise questions before a visit: which approaches or changes in level should be examined? Select reference points and take those questions into the field. Date and locate the observations so they can be connected with the starting view afterwards. This also helps colleagues who did not attend. They can understand where an observation was made and how it relates to the terrain under discussion. The model and field record perform complementary jobs within one investigation, with each retaining its own source and purpose.
Use two points to begin a more careful reading
The 1,038.97-metre difference is calculated from the two selected readings. A useful terrain enquiry does not have to begin by finding an area’s absolute maximum. Choose points connected to the assignment, record model, coordinates and values, then define the questions for a site visit. Being able to reopen the same points gives a site discussion a stable reference. It also helps the team identify which field evidence would be most useful next, moving from a broad appreciation of relief to a focused investigation of particular places.
Explore your own place
Open Mueang Chiang Mai in FABDEM, select two points relevant to the work and record their coordinates, elevation readings and field questions.
Sources and reading notesPublisher, period, coverage and references
Specialist source
- Data publisher
- FABDEM — Hawker et al. / University of Bristol; Copernicus DEM; Terrain Tiles — Mapzen / AWS Open Data
- Source
- FABDEM V1-2, Copernicus GLO-30 and Terrain Tiles have distinct roles. Distinguish elevation readings from the rendered 3D surface and check the source used at each location. FABDEM V1-2 is licensed CC BY-NC-SA 4.0; check each model’s terms before reuse, especially commercial use.
- Data period
- Versions and acquisition periods differ by DEM; tile-production dates are not survey dates.
- Coverage
- Coverage depends on the elevation model; source and resolution can vary by location
- Level of detail
- Elevation models and GLO-30 minus FABDEM differences; 3D rendering may smooth or exaggerate height
Further notes for comparison or citation
DEM elevations are modelled, not survey levels or a flood assessment. Differences between models are not measured building heights.
DEM values are not a land survey or flood-risk assessment. Differences between models are not verified building or tree heights, and no-data is not zero metres.
Captured on 10 October 2026. Values and available controls may change in the live service.