Living· CityMETER · Thailand · displayed flood-extent snapshot dated 1 September 2025
1 September 2025: keeping a flood map attached to its date
Flood: Latest ObservedThe CityMETER snapshot dated 1 September 2025 displays 2,343.55 square kilometres of observed flood extent. Attaching a date to the mapped water turns the coloured area into a record that can be read alongside reports from the same period.
A view inside CityMETER
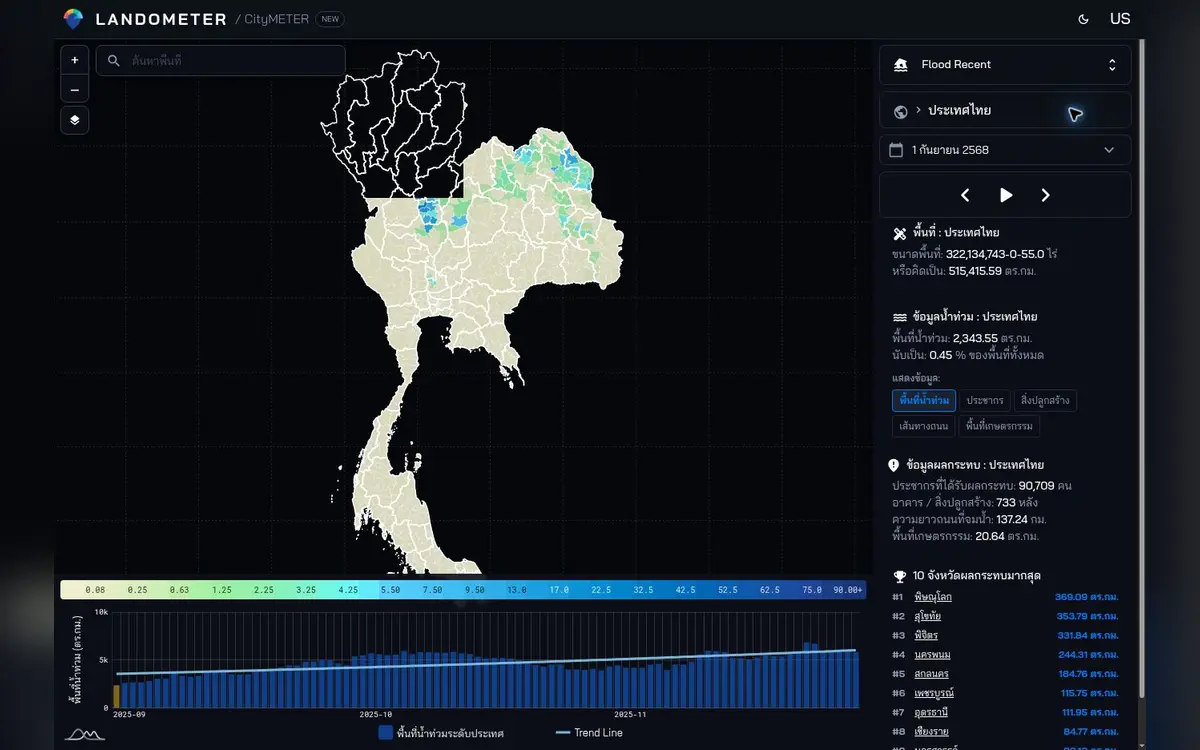
Observed-extent snapshot dated 1 September 2025 · square kilometres · viewed on 10 October 2026.
- Data period
- Read the details in sources
- Coverage
- Read the details in sources
- Level of detail
- Flood extent by observation date · spatial overlays
- Publisher
- Read the details in sources
A dated image connects different kinds of evidence
A flood-extent map presents a spatial view, while a local report often describes a particular point or community. A clear date gives those perspectives a shared place in a timeline. Begin with an area connected to the work and look for reports from the same day or nearby period. Reading the materials together helps organise the enquiry: which question concerns the mapped extent, and which requires a local account? Each source can contribute its own kind of detail, attached to a time that another reader can follow.
Choose a location for a practical reason
A building team or service coordinator may begin with a single location: an office, an entrance or a road connecting places. Examine how that location relates to the displayed extent and identify the documents needed to develop the picture. A specific starting point gives the retrospective enquiry a manageable scope. It also makes requests for information more concrete. Rather than ask for everything about flooding in a broad area, the team can explain the location, date and activity it is trying to understand.
Keep the meaning of each overlay visible
Buildings, roads or population information read alongside a flood extent add spatial context. Each layer brings its own unit. Separate the enquiry into observed extent, building locations, road alignments and the population basis, then write down the follow-up question for each. This gives colleagues with different responsibilities a way to use the same map while retaining the meaning of the figures being discussed. It also helps structure a note or briefing: the spatial relationship appears first, followed by the additional information needed for the particular task.
Make the historical snapshot useful to the next reader
When using the 1 September 2025 snapshot in a note, keep the date, area and study question together. Add related reports in chronological order, and attach later information as a new item with its own date. The record can then show how the enquiry developed. A colleague returning to it can understand the original map and the material added afterwards without rebuilding the whole context. The result is a useful account of a particular period, ready to support a more focused review of the place and activities involved.
Explore your own place
Choose one location in the 1 September 2025 snapshot and read it alongside local reports from the same period.
Sources and reading notesPublisher, period, coverage and references
Related reference — exact data release not confirmed
- Data publisher
- GISTDA flood boundary (candidate)
- Source
- GISTDA flood boundaries are a relevant reference. The exact file, observation date and method for overlaying exposed features still need confirmation.
- Data period
- Period not confirmed — check the reference date in the data view before use.
- Coverage
- A Thailand summary view is visible; source coverage is not stated
- Level of detail
- Flood extent for the observation date, with spatial overlays
Read the references
Further notes for comparison or citation
Satellite observations have timing and detection limits. This is not a live situation map, and blank areas do not establish safety.
The latest observed layer is a dated snapshot, not present conditions
Read the observation date before the word ‘latest’; uncoloured areas are not automatically safe and a snapshot is not live conditions.