Living· CityMETER · Pak Hai district · Phra Nakhon Si Ayutthaya
Pak Hai: a flood year larger than the fourteen-year average
Flood: RecurrentIn 2024, Pak Hai’s map shows an observed flood extent of 62.01 square kilometres, or 34.58% of the area. The annual average for 2011–2024 is 19.17%. Reading one year beside a longer history reveals how differently water can appear across the same place.
A view inside CityMETER
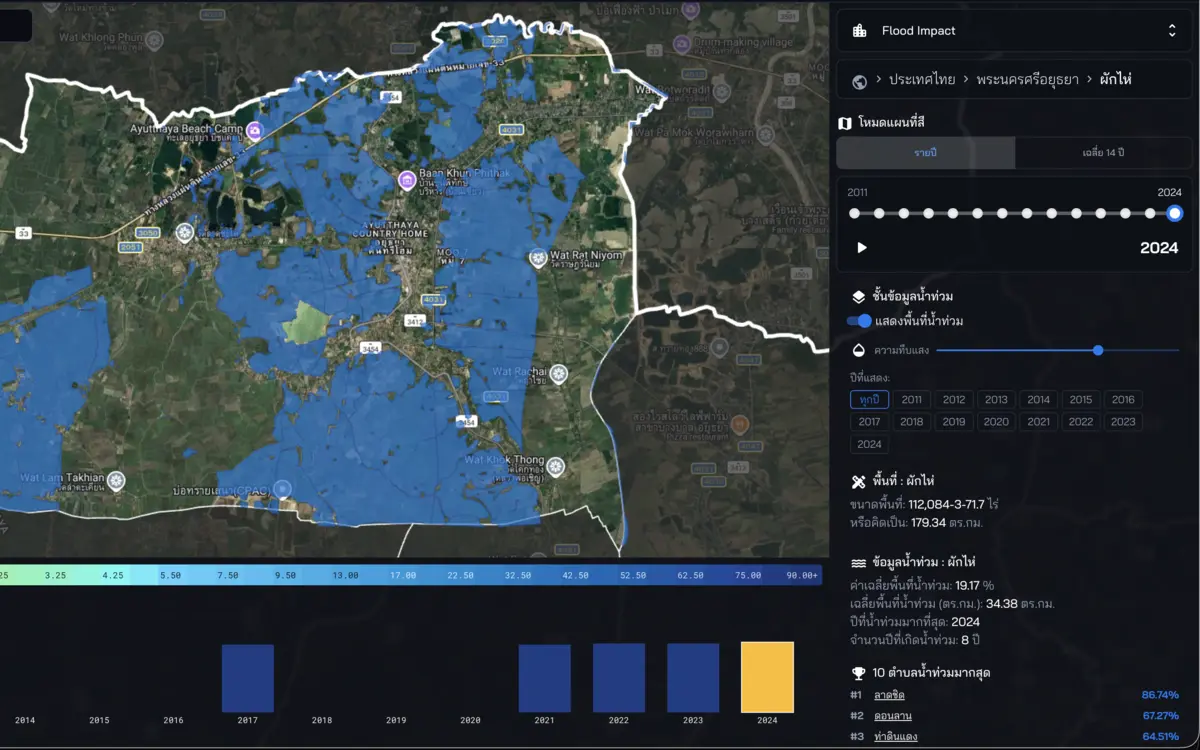
Pak Hai · observed flood-extent history, 2011–2024: fourteen years · detections in eight years · inspected on 10 October 2026.
- Data period
- Selectable years: 2011–2024
- Coverage
- Read the details in sources
- Level of detail
- Observed flood extent · years with detections
- Publisher
- GISTDA
One place holds more than one year of history
The 2024 figures make Pak Hai a concrete place to begin. Putting that year beside the longer average gives an individual event more context. A reader studying the area can return to the annual views and examine where the displayed extents appear. The enquiry has two dimensions: how much of the district is represented in a year, and where the mapped history sits. Looking at both helps organise a more precise conversation with people who know particular roads, settlements or sites in the district.
Eight recorded years create a reason to look closer
Detections appear in eight of the fourteen displayed years. That record helps choose periods to investigate in more detail. Start with a year connected to the enquiry, then examine the same location in another annual view. The sequence gives local conversations a specific reference: the year, the location and the feature being discussed. A reader can ask how access to a site or the use of a particular place was described at that time, and seek records that answer those questions. The historical map becomes a way to organise that search.
Bring the district history down to a relevant place
For a building-management or service-planning team, the district history opens the discussion. The next step is to identify the place connected to the actual work: a building, its entrance or a connecting route. Read that location’s mapped history alongside relevant local records. A clear place and year make it easier to gather accounts in an orderly way and explain where each observation came from. The team can keep the broader district view for context while developing a more detailed record of the locations that matter to its responsibilities.
Carry forward a comparable historical record
Keep the year, unit and area boundary with every map taken into a team discussion. Where annual views differ, write the question beside the relevant location and attach the documents or field observations gathered later as separate evidence. This gives the Pak Hai history a practical role in choosing study areas, preparing field questions and explaining why a particular site deserves attention. Another person can return to the same annual view and follow the enquiry. The value lies in building a history that remains understandable as new information is added.
Explore your own place
Open Pak Hai in 2024, compare one location across the annual history, and note the years and places to follow up in local records.
Sources and reading notesPublisher, period, coverage and references
Source
- Data publisher
- Geo-Informatics and Space Technology Development Agency (GISTDA)
- Source
- Historical flood layers from the GISTDA Disaster Platform Open API, confirmed by the team as the source.
- Data period
- Selectable years displayed in the explorer: 2011–2024
- Coverage
- A Thailand summary view is visible; source coverage is not stated
- Level of detail
- Observed flood extent by year and the number of years with detections in the selected period
Read the references
Further notes for comparison or citation
Past detections are not current conditions, a forecast or a statutory risk boundary. An area without records is not necessarily flood-free.
Historical recurrence is neither current conditions nor a forecast and does not replace a statutory risk determination
Use for recurrent history—not current conditions, a forecast or a statutory risk determination.