Living· CityMETER · Thailand · fiscal year 2024
Local revenue has a composition as well as a total
Municipal RevenueWhen discussing local services, total revenue describes scale while its composition opens a different planning conversation. CityMETER’s fiscal-year 2024 view displays 554,443 million baht in revenue, divided into own-source revenue, allocated revenue and grants. Looking at those parts gives the total a more useful context.
A view inside CityMETER
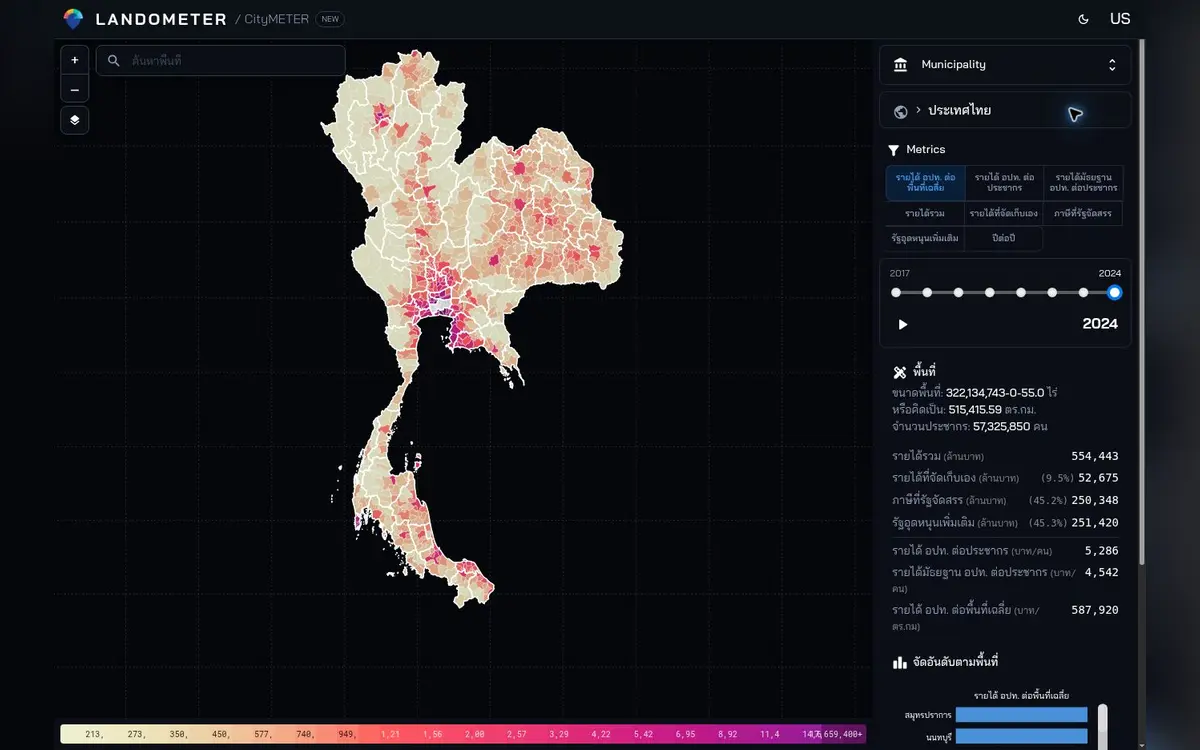
Thailand view inspected on 10 October 2026 · fiscal year 2024 · own-source revenue 9.5%, allocated revenue 45.2% and grants 45.3% of the displayed total.
- Data period
- FY2017–2024 in CityMETER
- Coverage
- Read the details in sources
- Level of detail
- Local authorities · fiscal year · per-person/area summaries
- Publisher
- Department of Local Administration
Ask how each part of revenue enters the plan
The national composition shows allocated revenue and grants at similar shares, with own-source revenue forming a smaller part. Carry that distinction into a study of the local authority relevant to your project. Read its revenue composition before choosing questions for the finance team: when do the different receipts enter the planning cycle, and which service plans should the discussion examine? Separating the components helps the team request appropriate documents and prepare a focused conversation. The responsible officers can then explain how the revenue figures connect with the authority’s planning process, giving each part of the total an identifiable role in the enquiry.
Bring scale into the comparison deliberately
The authorities being studied may differ in population and land area. CityMETER allows revenue to be examined as a total and through per-person or per-area measures. First decide whether the question concerns overall resources or the context of serving a particular geography. Then use the measure that fits that question and retain its year, boundary and unit beside the result. Making the denominator explicit helps everyone in a meeting understand the comparison. It also helps determine which supporting material to request next, whether the discussion needs details about the population being served, the territory involved or the service activity to which the revenue enquiry relates.
Read several years as a planning sequence
The application offers fiscal years 2017–2024, allowing a study to follow the composition of revenue through time. Keep the local authority and reading unit consistent, then identify the parts that change during the period of interest. Take those years into the authority’s own documents or related planning records. This creates a sequence that colleagues can examine together: the selected figures identify a period worth understanding, and the documents provide the context for the discussion. A useful comparison therefore records the years and components under review and leads to specific follow-up, rather than leaving the team with a chart that is difficult to connect to its project.
Connect the financial question to a particular service
Choose one service connected with everyday life, such as maintaining public space, and state what the team wants to understand about its resources. Bring the selected revenue view with its year and components, then invite the relevant staff to explain the work and supporting documents. Keep the financial comparison and service information as distinct, connected parts of the study. That makes the revenue map a useful opening to a practical conversation. The next proposal can refer back to a defined place and period, explain which part of the resource picture was examined and set out the questions that emerged from the discussion.
Explore your own place
Choose an authority, year and comparison unit, then use the revenue composition to prepare a focused service-planning conversation.
Sources and reading notesPublisher, period, coverage and references
Reference checked
- Data publisher
- Department of Local Administration
- Source
- References the Department of Local Administration localincome dataset. Population and area denominators require separate source references from the revenue figures.
- Data period
- The inspected CityMETER view offers fiscal years 2017–2024; the upstream DLA catalogue extends to 2025. Check the selected year; a newer source release does not establish that it has been imported.
- Coverage
- A Thailand summary view is visible; source coverage is not stated
- Level of detail
- Local authorities by fiscal year with per-person or per-area summaries
Read the references
Further notes for comparison or citation
Revenue does not describe service quality or the full fiscal position. Match years and denominators; upstream years may differ from the years available in CityMETER.
Revenue is not overall service quality or fiscal capacity; read it with the accounting year and denominator definitions
Compare own-source, allocated, grant and total revenue. Per-capita/area metrics are CityMETER calculations and are not service quality.