Living· CityMETER · Thailand · September 2026
The same population total can ask different things of a city
Population by Age & SexBefore planning a playground, a classroom or a service for older people, it helps to ask which age groups live on the local register. CityMETER’s September 2026 Thailand view displays 64,458,471 registered people. Looking inside that total brings the conversation closer to the different stages of life a service might support.
A view inside CityMETER
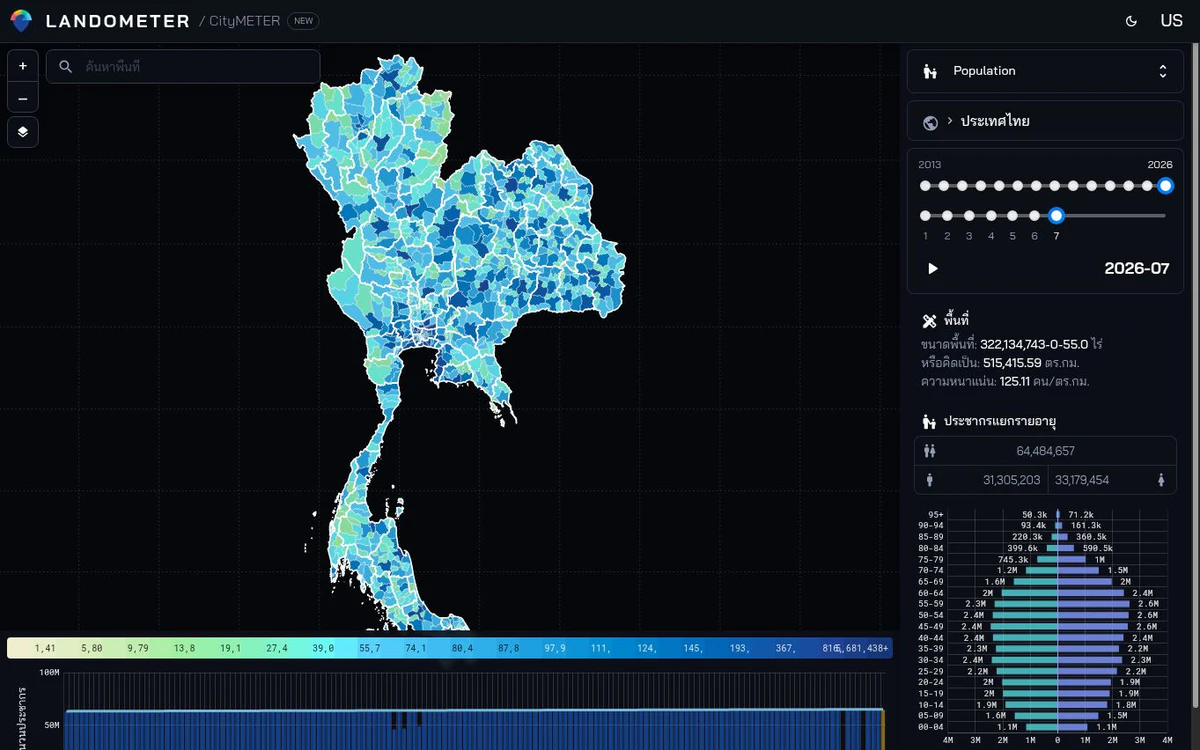
Thailand view inspected on 10 October 2026 · September 2026 reference month · 31,288,030 male and 33,170,441 female registered people · registered population density: 125.06 people/km².
- Data period
- Monthly · selections from 2013
- Coverage
- Read the details in sources
- Level of detail
- Registered population · area, age and sex
- Publisher
- BORA, Department of Provincial Administration
Start with the life stage behind the service
Begin with a service that has a clear audience, such as a play space for children or activities for older people. Select the relevant ages and consider both the number of registered people and their share of the area’s total. The count helps frame the possible scale of an enquiry; the share describes the age composition around it. If two areas have similar totals but different age profiles, the team has a reason to explore different service formats. This turns an initial conversation with a school, service centre or community group into something more specific: which ages should the discussion focus on, and what would the team like to understand about them?
Read the count alongside the space it occupies
The national screen’s density of 125.06 registered people per square kilometre gives the measure a clear unit. For a local study, place the registered count beside the area used to calculate density. Then use that same boundary when examining the service locations being considered. Reading people and space together helps organise questions about how service points are distributed and where travel deserves closer study. One part of the assignment can examine the size and age profile of the intended group, while another examines routes and access. The useful connection is a shared geography that lets those two pieces of work be discussed together.
Give every comparison a reference month
The available monthly selections begin in 2013, opening a longer view of how registered age structure changes. Choose the same month in different years and keep the age selection and boundary with the comparison. A change in the selected records can then become a focused question for local service providers: how has their work changed over the corresponding period? A consistent reference makes that conversation easier to revisit. When the team returns to a proposal later, it can repeat the same comparison and connect the result with what providers have learned, rather than relying on a remembered impression of whether an area feels younger or older.
Turn an age profile into a useful conversation
A practical outcome can be a single map brief identifying the place, month, age group and questions for the people involved. Those questions might concern suitable activity times or the areas from which service users travel. Add service-use records and community conversations to the team’s own study. Returning to the map then gives everyone a common reference: the registered profile frames the enquiry, while local experience adds the detail needed to shape a service. This is how a broad population view becomes useful to a particular project, with an explicit audience and a small set of questions that someone can actually take forward.
Explore your own place
Choose an area, reference month and age group, then take a focused set of questions to service providers and the community.
Sources and reading notesPublisher, period, coverage and references
Reference checked
- Data publisher
- Bureau of Registration Administration, Department of Provincial Administration
- Source
- Monthly age, sex and area dimensions align with DOPA statistics for people listed in house registration.
- Data period
- Selections start in 2013. Use the reference month shown for the selected data, not a claim of the population at this moment.
- Coverage
- A Thailand summary view is visible; source coverage is not stated
- Level of detail
- Registered population by area, age, sex and reference month
Further notes for comparison or citation
These are registered residents in the reference month, not everyone present during the day or actual service users.
This is not daytime population, income, service eligibility, or evidence of local behaviour
Use for age-structure planning, but call it registered population—not daytime, resident or live population.