Location· CityMETER · Bangkok
Finding the relevant neighbours in Bangkok’s restaurant map
Restaurants: Density, Ratings & PriceThe Bangkok view contains 44,086 restaurant records, averaging 28.06 records per square kilometre. That citywide number reveals the scale of the recorded network. A useful strategy question starts closer in: which types and price bands share the neighbourhood being considered?
A view inside CityMETER
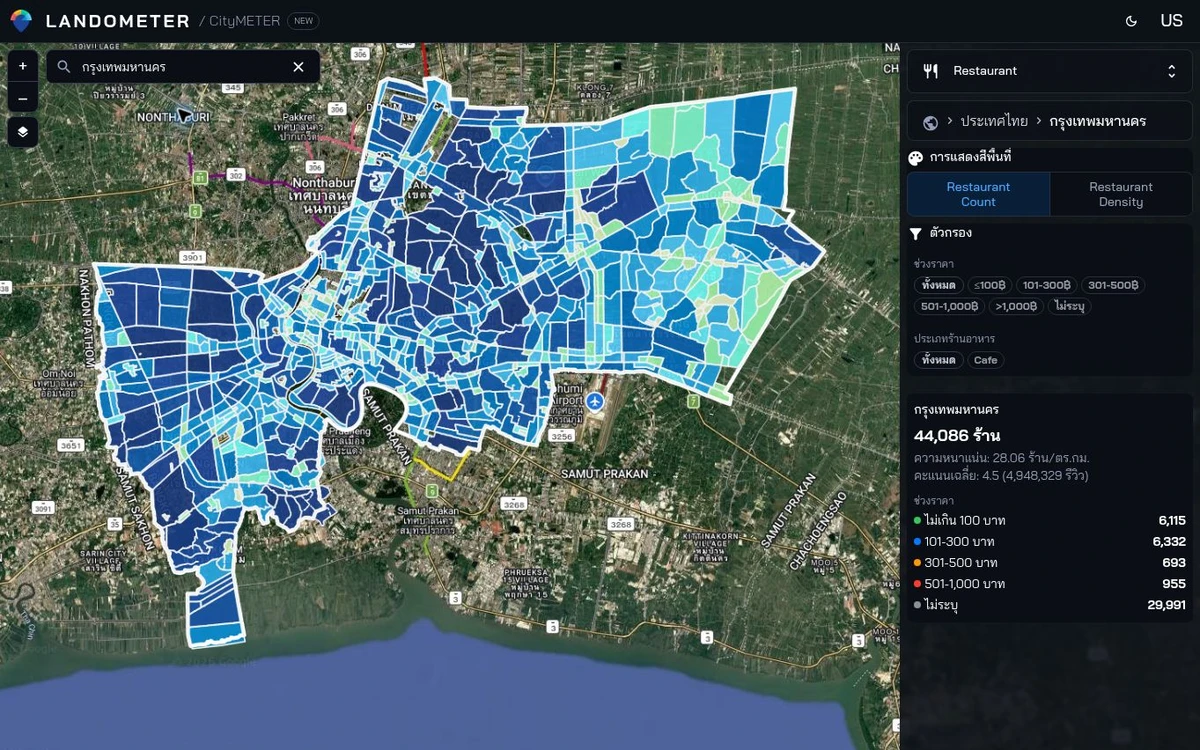
Bangkok · inspected on 10 October 2026 · recorded restaurants and records per km² · type and price-band selections are available.
- Data period
- Read the details in sources
- Coverage
- Read the details in sources
- Level of detail
- Recorded restaurants · categories · prices · available ratings
- Publisher
- Read the details in sources
Look at the mix, not just the number
Restaurants near one another may serve different purposes. Separating type and price band helps a team identify a comparison relevant to its concept or service. Begin with the intended area and read the kinds of records represented there. The mix can give a field visit a specific agenda: investigate menu formats or ask about opening periods, for example. This moves the enquiry beyond a general impression that an area has many restaurants. It gives the team a reason to look at particular places and a shared question to bring back from them.
Bring the citywide density back to a place
The 28.06-record density summarises the Bangkok boundary used in the view. When studying a particular location, retain the boundary and selections used for that more local enquiry. A clearly defined comparison area lets colleagues see which part of the city is being examined and choose a realistic field route. If the result is shared, carry both the record count and the area behind the calculation. This makes the comparison intelligible to someone who was not present when the map was opened and helps the same enquiry be repeated later.
Read reviews with a specific question in mind
The inspected view also displays a 4.5 mean rating and 4,948,329 reviews in the presented set. Those figures invite a more focused reading of the reviews associated with relevant restaurants. What aspects of menu or service are being discussed? Record the themes worth investigating and connect them with a visit to the place. Retain the review source and reading date in the working note. This keeps the enquiry attached to the material actually examined and helps distinguish a recurring question for fieldwork from a general impression carried away from the screen.
Design a visit that answers a strategy question
Choose a neighbourhood and the restaurant types relevant to the assignment. Build a visit list with a reason for each stop: a price band to study or a service format to ask about. Define the questions before leaving and record answers consistently. The team returns with both the network picture and place-specific observations for the next discussion. That is how a citywide inventory becomes a bounded strategy exercise—with an explicit geography, a selection of relevant comparisons and a set of questions that people can investigate rather than simply debate.
Explore your own place
Choose a neighbourhood, restaurant type and price band, then define one question that a visit to the actual restaurants should answer.
Sources and reading notesPublisher, period, coverage and references
Source details still need confirmation
- Data publisher
- Original place and review-data publisher not yet verified
- Source
- The providers of restaurant listings, review ratings and price bands are not fully documented.
- Data period
- Period not confirmed — check the reference date in the data view before use.
- Coverage
- A Thailand summary view is visible; source coverage is not stated
- Level of detail
- Recorded restaurants, categories, prices and available review scores
Further notes for comparison or citation
Restaurant and review counts are not sales or customer volumes. Ratings are not independent quality assessments.
Restaurant and review counts are not demand or customer counts; source and collection date are not documented
Use as competitive context, not demand, customer count or independently verified quality; collection date and coverage are required for comparison.