Land· CityMETER · Phrae
Reading a growing season in Phrae, one reporting month at a time
Agriculture: Crop Area & Output (10,000 Rai)The Phrae view for October 2026 shows 48.22 rai of cultivated area in the records reported so far. With the month still in progress, the useful story is the rhythm of reporting and the crops behind it: where should a supply enquiry begin next?
A view inside CityMETER
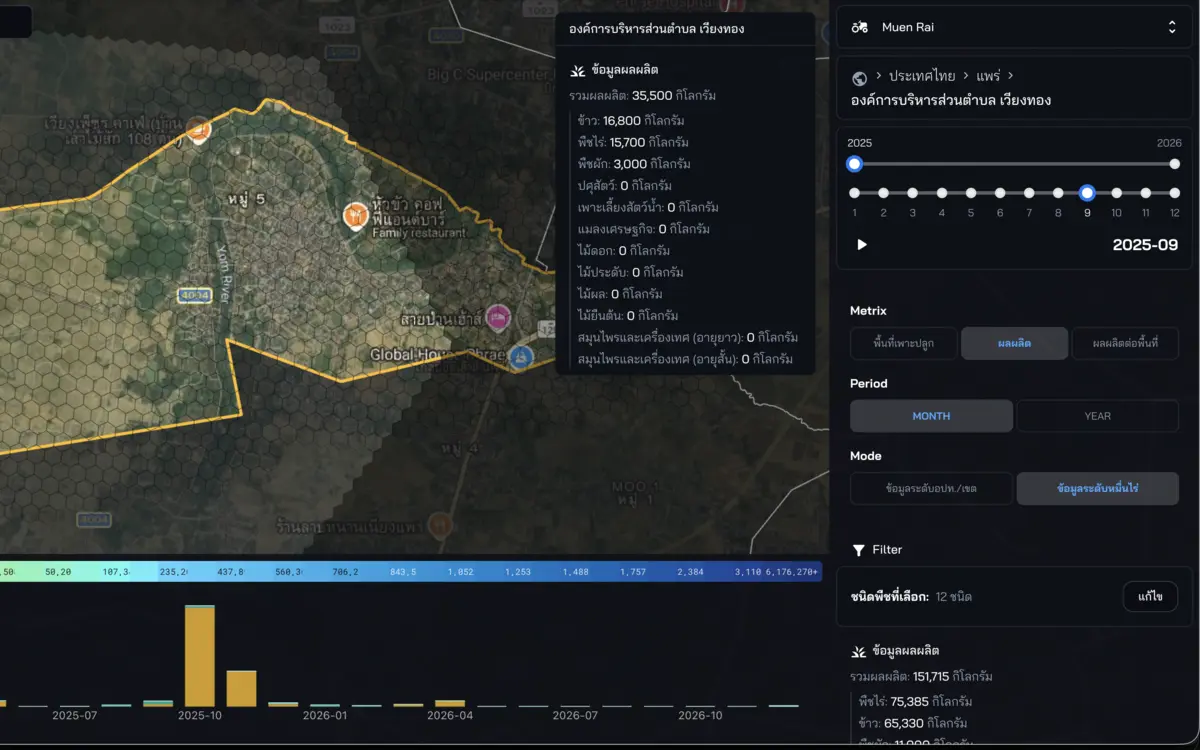
Phrae · October 2026, a month still in progress · inspected on 10 October 2026 · displayed cultivated area: 48.22 rai.
- Data period
- Read the details in sources
- Coverage
- Read the details in sources
- Level of detail
- Area · agricultural activity · selected month or year
- Publisher
- Read the details in sources
A month sits inside a longer season
A person planning a supply enquiry needs to know what is grown, when activity is recorded and when output might be relevant to the assignment. Monthly data lets those questions be separated. Cultivated area, output and output per area describe different aspects of farming activity. In Phrae, an October starting point invites a look at earlier months and the selected crop. Keeping the time basis consistent turns the comparison into a sequence about a particular crop, rather than a collection of figures gathered at different points in the reporting cycle.
Give the field enquiry a route
The spatial view can help a team begin with areas containing relevant records, then prepare questions for the people producing or collecting the crop. Harvest timing, intended sales and collection arrangements are subjects for those conversations. The map gives the enquiry a route and a reason for choosing it. Keeping place and crop together also helps divide the work among colleagues. Each answer can return to the record that prompted the visit, allowing the team to build a local understanding instead of accumulating disconnected phone notes.
Let the units do their work
Reading cultivated area in rai and output in the unit shown for the selected crop keeps scale and production distinct. If the crop or time selection changes, carry the unit and selection with the value. That small record matters when the work moves between people. The next colleague can see what question produced the number and what still needs to be discussed locally. It also makes comparisons easier to repeat, because the same crop, period and measure can be selected again instead of relying on an unlabeled figure in a presentation.
From a monthly figure to a supply conversation
The 48.22 rai displayed for this month is a starting point; a figure does not have to be large to lead to a useful enquiry. Select the crop relevant to the work, examine earlier periods and note where the records appear. Use that information to identify whom to contact and what to ask. Once timing, quantities and delivery arrangements have been discussed, the team has two connected forms of knowledge: a picture of reported activity and practical details obtained through follow-up. Each can be revisited without losing the reason the enquiry began.
Explore your own place
Select one crop in Phrae, compare like reporting periods and use the listed areas to prepare questions about harvest and collection arrangements.
Sources and reading notesPublisher, period, coverage and references
Related reference — exact data release not confirmed
- Data publisher
- Department of Agricultural Extension production registry family (candidate)
- Source
- The records relate to crop-production reporting, but the exact source for the displayed crop categories and monthly figures is not yet confirmed. Check source and units before comparing.
- Data period
- Period not confirmed — check the reference date in the data view before use.
- Coverage
- Geographic coverage is not stated on the public page
- Level of detail
- Agricultural statistics by area, activity and selected month or year
Further notes for comparison or citation
Incomplete monthly reports are not annual output, and recorded production is not all available for purchase.
Check units, area and reporting period before comparison. An incomplete reporting month is not annual output, and recorded output is not the total amount available for purchase.